Aneuploidy Analysis from Whole Genome Sequencing Data
Aneuploidy — the presence of an abnormal number of chromosomes — is a well-known driver of cancer and developmental disorders. While karyotyping and chromosomal microarray have been the traditional tools for detecting aneuploidy, whole genome sequencing (WGS) data can also be leveraged for this purpose. In rare disease diagnostics, ruling out or confirming aneuploidy from existing WGS data avoids additional testing and speeds up the diagnostic process.
This analysis was performed as part of a case study published in Haematologica, where we investigated fraternal twins with HJV mutations causing hemochromatosis but with highly discordant iron overload severity. One of the twins carried a BUB1B variant associated with mosaic variegated aneuploidy syndrome, which motivated a genome-wide aneuploidy assessment from WGS data to rule out chromosomal abnormalities as a contributing factor.
In this post, I walk through the practical approach used for assessing aneuploidy from germline WGS data using two complementary tools: AStra and QDNAseq.
Why Assess Aneuploidy from WGS?
In rare disease programs like the Undiagnosed Diseases Network (UDN), patients typically receive WGS as part of their evaluation. When a case involves phenotypes that could be explained by chromosomal abnormalities — such as developmental delay, growth restriction, or congenital anomalies — checking for aneuploidy directly from the existing sequencing data is a practical first step before pursuing more targeted assays.
Tools
AStra
AStra generates genome-wide aneuploidy profiles and aneuploidy spectra from WGS data. It corrects for GC content and mappability biases, segments the genome, and calls gains and losses relative to a diploid reference. The aneuploidy spectrum — a frequency distribution of read depths — provides a clear visual summary of the ploidy state.
Reference: Khalil AIS, Chattopadhyay A, Sanyal A. Analysis of Aneuploidy Spectrum From Whole-Genome Sequencing Provides Rapid Assessment of Clonal Variation Within Established Cancer Cell Lines. Cancer Inform. 2021;20:11769351211049236. PMID: 34671179
The figure below from Khalil et al. shows an example of AStra output on MCF7 cancer cell line strains. On the left, the aneuploidy profile shows copy number states per genomic segment. On the right, the aneuploidy spectrum shows the read depth frequency distribution, where the red line denotes the RD median and the dotted black lines denote CN states.
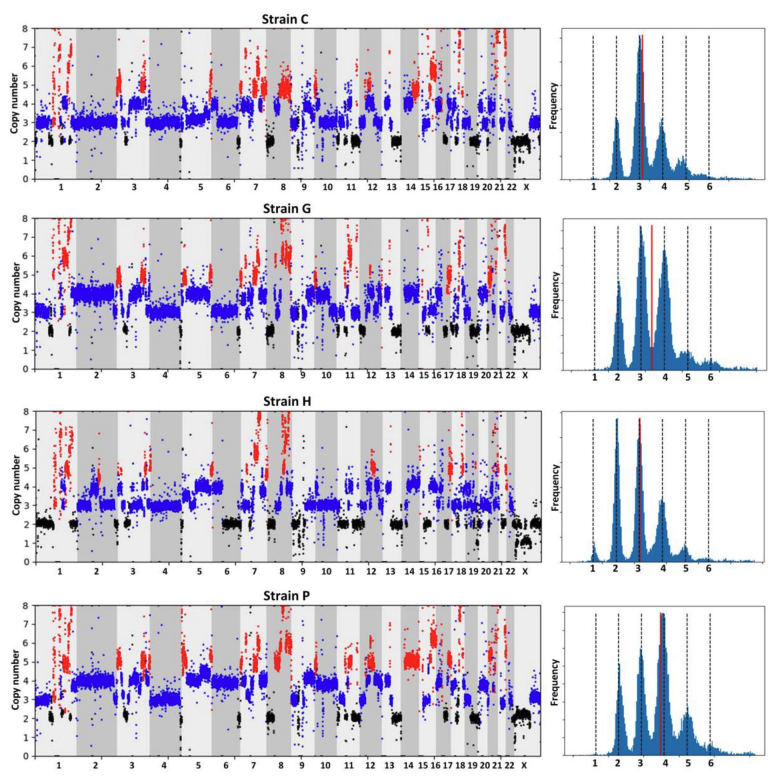 Figure 1: From Khalil, A. I. S., Chattopadhyay, A., & Sanyal, A. (2021). Genome-wide aneuploidy profiles (left) and aneuploidy spectra (right) for MCF7 strain C, G, H, and P.
QDNAseq
QDNAseq is a Bioconductor R package for DNA copy number analysis from shallow or standard-depth WGS. It uses fixed-size bins across the genome, applies corrections for mappability and GC content, and produces segmented copy number profiles with gain/loss calls.
Reference: Sie D, et al. QDNAseq: A bioinformatics pipeline for DNA copy number analysis from shallow whole genome sequencing with noise levels near the probabilistic lower limit imposed by read counting. Clinical Cancer Research. 2016;22(1_Supplement):52-52.
Approach
The analysis follows a trio design (proband + mother + father), which provides built-in controls — unaffected parents are expected to be diploid, and any deviation in the proband relative to both parents is more likely to be real.
WGS BAM/CRAM (Proband + Parents)
    │
    ├── AStra
    │     ├── GC & mappability correction
    │     ├── Segmentation & CN calling
    │     ├── Aneuploidy profile (per chromosome)
    │     └── Aneuploidy spectrum (genome histogram)
    │
    └── QDNAseq
          ├── Bin-level read counting
          ├── GC & mappability correction
          ├── Segmentation
          └── CN profile with gain/loss calls
Running both tools independently serves as mutual validation. If both agree on the ploidy state, confidence in the result is high.
Interpreting the Results
Aneuploidy Profile
The aneuploidy profile shows copy number states across all chromosomes. For a normal diploid sample, the profile should be flat at CN=2 across all autosomes, with expected differences on sex chromosomes.
Key things to look for:
- Whole-chromosome gains or losses (trisomy, monosomy)
- Segmental aneuploidies (partial gains/losses of chromosome arms)
- Consistency between proband and parents — deviations present in the proband but absent in both parents suggest a de novo event
Below is an example from the QDNAseq documentation (low-grade glioma sample LGG150, chromosomes 7–10) showing how CN profiles look after correcting for GC content, mappability, segmenting, and calling gains and losses. This helps illustrate how to interpret the actual trio results in Figure 5.
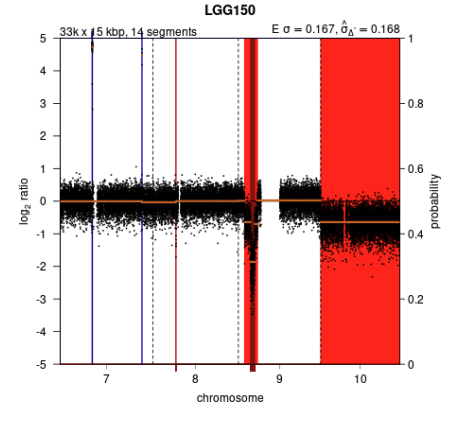 Figure 2: Example from QDNAseq documentation — CN profile after correcting for GC content, mappability, segmenting, and calling gains and losses.
Aneuploidy Spectrum
The aneuploidy spectrum is a histogram of read depth values across the genome. In a diploid sample, the distribution should have a single sharp peak centered at CN=2. Additional peaks or broad shoulders would indicate the presence of cells with different copy number states.
For all three samples, the aneuploidy spectrum shows no significant deviation — each has a clean, single-peak distribution.
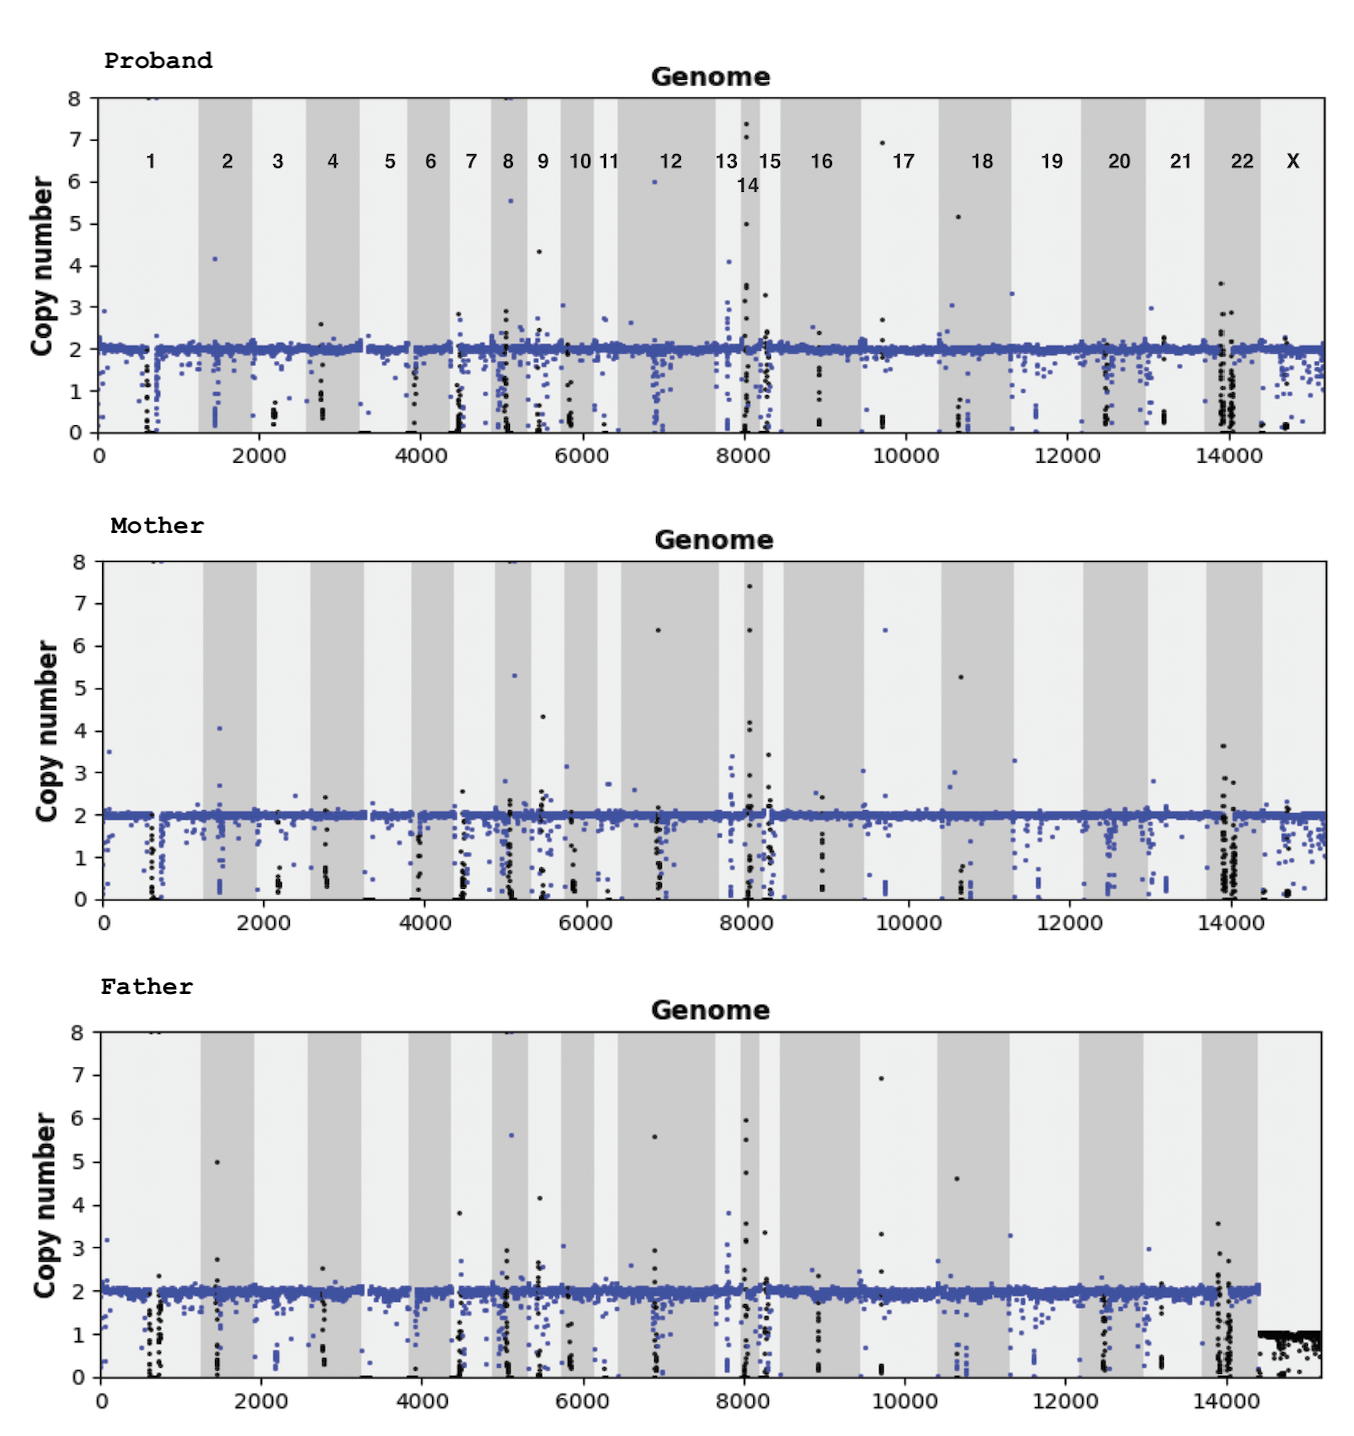 Figure 3: AStra aneuploidy spectrum histogram for all samples. No significant change in the aneuploidy profile across the trio.
QDNAseq Read Count Profile
QDNAseq provides a complementary view with bin-level resolution. The segmented profile should align with AStra’s results. Gains appear as segments above the baseline, and losses appear below.
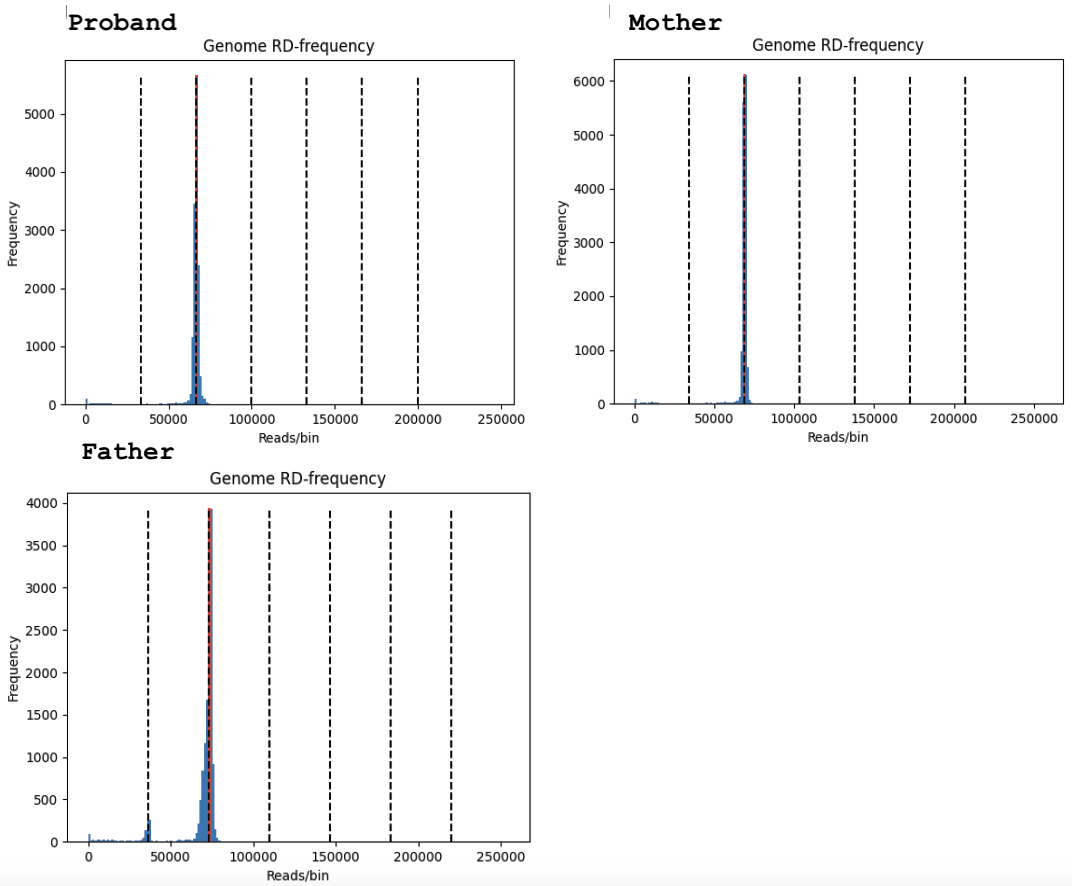 Figure 4: QDNAseq histogram for aneuploidy spectrum for all samples. The read depth (RD) median (red line) and CN states (black line) refer to CN=2 (diploid).
QDNAseq CN Profile
The full QDNAseq CN profile across the genome for all three samples confirms the diploid state, with no gains or losses called in any sample.
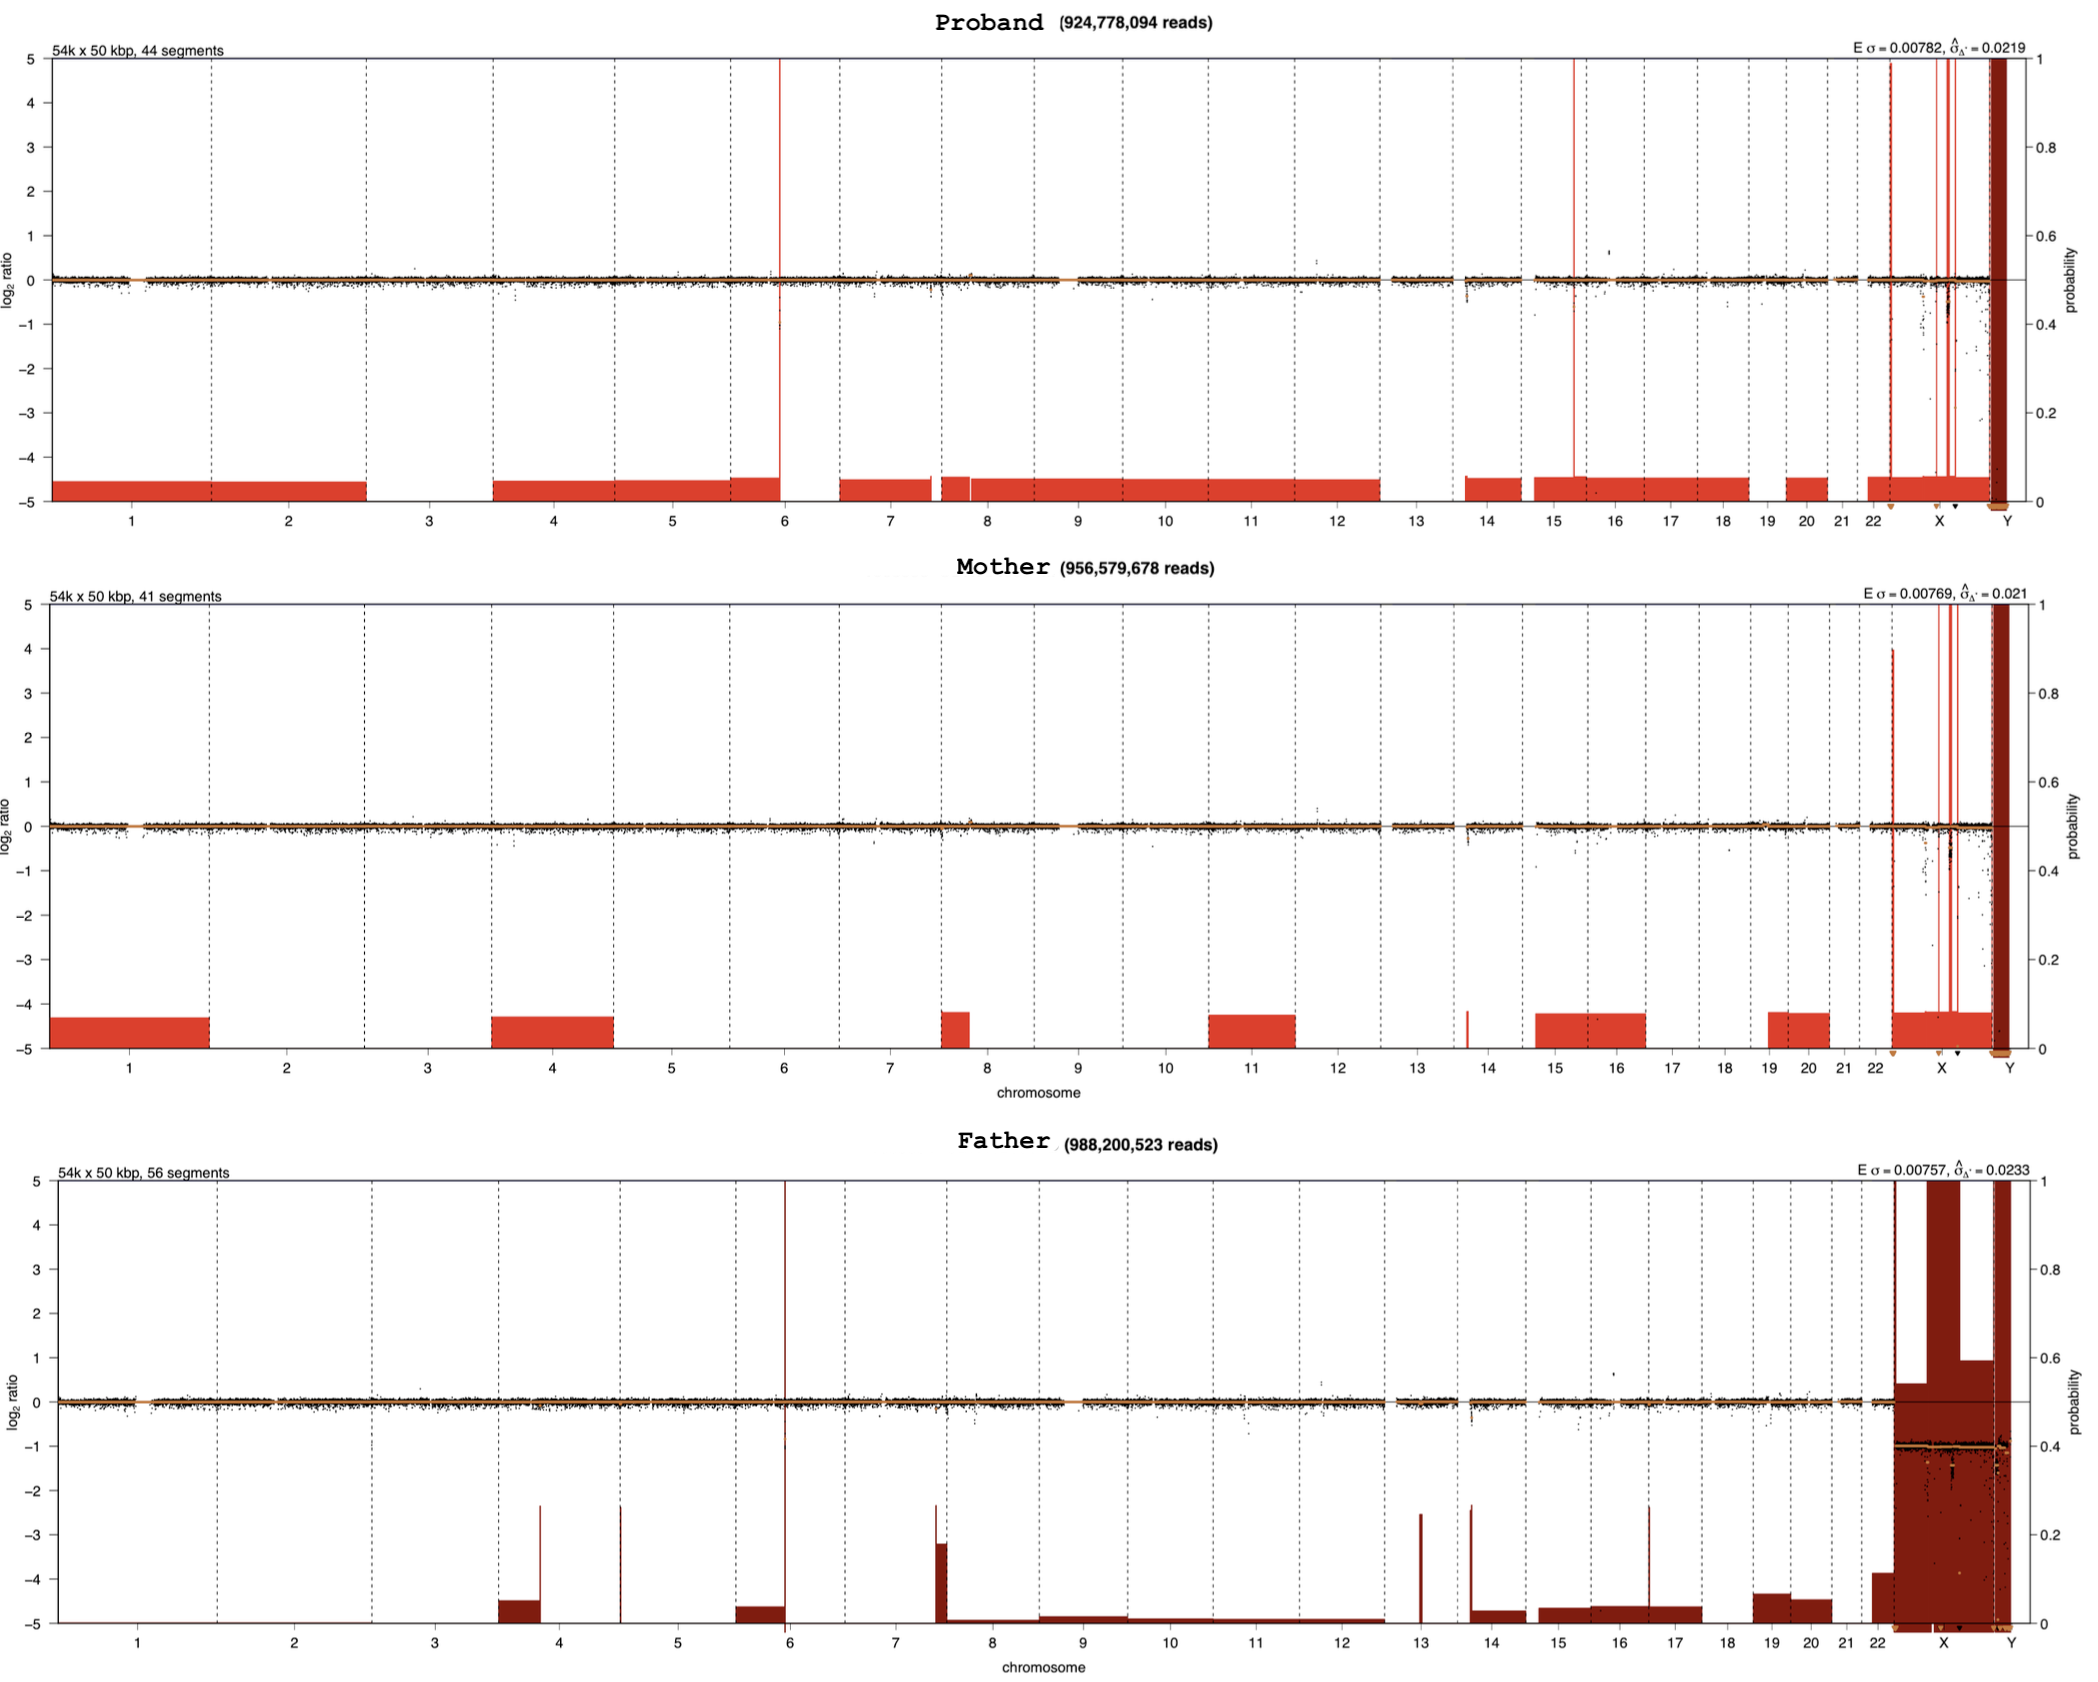 Figure 5: QDNAseq CN profile after calling gains and losses across the genome for all samples.
Example: Diploid Confirmation in a Trio
In a recent case, a proband and both parents were analyzed:
| Sample | Ploidy State | CN=2 Coverage |
|---|---|---|
| Proband | Diploid | 93.24% |
| Mother | Diploid | 93.24% |
| Father | Diploid | 87.91% |
Both AStra and QDNAseq confirmed diploid states across all three samples with no significant deviations. The aneuploidy spectra showed clean, single-peak distributions centered at CN=2. The slightly lower CN=2 coverage in the father is within normal variation and likely reflects noise in regions with low mappability.
This result effectively rules out aneuploidy as the cause of the proband’s phenotype, redirecting the diagnostic effort toward sequence-level variants (SNVs, indels, structural variants) instead.
When This Analysis Is Most Useful
- Phenotypes suggestive of chromosomal abnormalities — developmental delay, intellectual disability, multiple congenital anomalies, growth abnormalities
- Cases without prior karyotype or CMA — extracting aneuploidy information from existing WGS avoids additional testing
- Mosaic aneuploidy screening — AStra’s spectrum can reveal low-level mosaicism as secondary peaks in the read depth distribution
- Quality control — unexpected aneuploidies can indicate sample swaps or contamination
Practical Tips
- Always analyze the trio together. Parents provide a baseline — if something looks off in the proband, check if the same pattern appears in a parent before calling it significant.
- Use both tools. AStra excels at the spectrum-level overview while QDNAseq provides finer bin-level resolution. Agreement between both increases confidence.
- Check sex chromosomes separately. The expected CN differs by sex (XX vs XY), so sex chromosome aneuploidies like Turner (45,X) or Klinefelter (47,XXY) require sex-aware interpretation.
- Consider sequencing depth. Shallow WGS (~0.1-1x) works for large-scale aneuploidies but may miss smaller segmental events. Standard clinical WGS (~30-40x) provides sufficient resolution for both.
References
- Khalil AIS, Chattopadhyay A, Sanyal A. Analysis of Aneuploidy Spectrum From Whole-Genome Sequencing Provides Rapid Assessment of Clonal Variation Within Established Cancer Cell Lines. Cancer Inform. 2021;20:11769351211049236. PMID: 34671179
- Sie D, et al. QDNAseq: A bioinformatics pipeline for DNA copy number analysis from shallow whole genome sequencing. Clinical Cancer Research. 2016;22(1_Supplement):52-52.